To Open The Sky
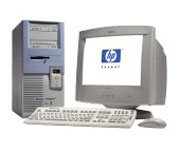
Adding a Second CPU to the HP Kayak
The Black Art of Benchmarking
Benchmarking's goal is simple: To measure the performance of a given computer. This can be done by comparing it to some standard machine such as the manufacturer's base model, or perhaps to a supercomputer. (The latter comparison is done most often for scientific problems, and if done for your personal machine, is certain to induce envy. The envy is pointless because, even if you are someone like Larry Ellison, you are unlikely to be able to afford a supercomputer. The situation is much like a private pilot comparing his Cessna 172 to a Boeing 747. In purpose as well as in cost, those planes are in different categories.)
Ideally, you'd have access to the comparison machine and be able to run the same program on it as on yours. In practice, this is seldom possible even for businesses. Therefore, benchmarking is usually done with a standardized suite of programs designed to subject the computer to a realistic processing load. The benchmarking suite produces a set of numbers that can be compared to published results for various machines.
There are pitfalls in this. First, the programs might be biased in favor of one manufacturer's machines; but this is rare because most benchmarking suites come from independent firms. Of more importance are the many differences in possible computer configuration, and the difficulty of finding published results for computers that match yours in all but one factor.
In addition to the obvious ones of CPU and hard disk speed, some of the factors that affect performance are:
- Amount of cache memory, and how it is coupled to the CPU
- Amount of main memory
- Type of video card, and how much VRAM it carries
- I/O bandwidth, which determines how fast the CPU can exchange data with other components
Even assuming all the machine's components are perfectly matched, there is often a host of software settings that have to be optimized for best performance. Considering all this, many people do not bother with benchmarking; they simply buy a better computer if the one they have doesn't get the job done as fast as they like.
Here are comparisons of some flavors of Pentium-II Kayaks using 3D graphics benchmarks.
| NURBS | NURBS | Poly | Poly | |||
|---|---|---|---|---|---|---|
| System Description | Anim | IK | Def | GL | Def | GL |
| Results are in seconds. Error margin: ±0.3 sec. All systems have 512MB RAM. Source: http://www.futuretech.blinkenlights.nl/lumis.html (checked 8 Jan. 2018) |
||||||
| HP Kayak XW: Dual PII 400MHz CPUs and HP fx4 video card | 194.5 | 318.5 | 69.5 | 288.5 | 63.5 | 463.0 |
| HP Kayak XW: Dual PII Xeon 450MHz CPUs and HP fx6 video card | 183.7 | 321.7 | 66.3 | 231.7 | 66.0 | 408.0 |
| IBM Intellistation ZPro: Dual PII 450MHz CPUs and Intense3D Pro 3400 video card | 151.3 | 205.3 | 57.7 | 229.3 | 57.3 | 393.0 |
| SGI Visual Workstation 320: Dual PII Xeon 450MHz CPUs | 88.0 | 254.3 | 48.0 | 308.3 | 42.0 | 492.0 |
| Intergraph TDZ2000: Dual PII Xeon 450MHz CPUs and GX1 Wildcat 4000 video card | 163.0 | 201.3 | 55.7 | 219.0 | 53.0 | 366.0 |
Here are some results using the floating-point routines of the SPEC2000 benchmark suite on 800 MHz Intel Pentium-III Coppermine machines. The results compare the two front-side bus (FSB) speeds of 100 and 133 MHz. The source (see table footer) goes beyond this to extrapolate performance to the 400MHz FSB used by Pentium-4 CPUs.
| Benchmark | Program | FSB Speed | Performance | |
|---|---|---|---|---|
| Program | Category | 100 MHz | 133 MHz | Gain (%) |
| SPECfp2000 results for Pentium III (coppermine) 800 MHz with different FSB* Source: http://www.geocities.com/tnaw_xtennis/Pentium4-4.htm (checked 8 Jan. 2018; see the Wayback Machine for 2009.) |
||||
| 168.wupwise | Physics & Quantum Chromodynamics | 288 | 296 | 2.8 |
| 171.swim | Shallow Water Modelling | 267 | 365 | 36.5 |
| 172.mgrid | Multigrid Solver: 3D Potential Field | 189 | 210 | 11.1 |
| 173.applu | Parabolic/Elliptic Equations | 188 | 206 | 906 |
| 177.mesa | 3D Graphics Library | 309 | 316 | 2.3 |
| 178.galgel | Computational Fluid Dynamics | 247 | 284 | 15.0 |
| 179.art | Image Recognition & Neural Networks | 262 | 298 | 13.7 |
| 183.equake | Seismic Wave Propagation Simulation | 271 | 276 | 1.8 |
| 187.facerec | Image Processing Face Recognition | 217 | 220 | 1.4 |
| 188.ammp | Computational Chemistry | 260 | 260 | 0.0 |
| 189.lucas | Number Theory & Primality Testing | 239 | 258 | 7.9 |
| 191.fma3d | Finite-Element-Method Crash Simulation | 237 | 244 | 3.0 |
| 200.sixtrack | High Energy Particle Accelerator Design | 139 | 140 | 0.7 |
| 301.apsi | Meteorology: Pollutant Distribution | 269 | 292 | 8.0 |
| N/A | Average | 237 | 256 | 8.0 |
And here are some benchmarks for the current and past few generations of CPU chips from Intel Corporation. Note the omission from the published data of several important factors.
| CPU Type | CPU | RAM | M'Board | O/S | Run | Speed | Time |
|---|---|---|---|---|---|---|---|
| and Qty | Speed | Size | Chipset | Type | Time | Change | Change |
| (MHz) | (MB) | (Sec) | (%) | (%) | |||
| Results are in seconds. Source: http://www.caselab.okstate.edu/research/benchmark.html (checked 8 Jan. 2018) |
|||||||
| Mobile Celeron | 466 | 64 | ? | Win 98 | 2196.4 | ||
| Celeron | 600 | 64 | ? | Win 98 | 1438.2 | 22.3 | 52.7 |
| Pentium II | 333 | 64 | ? | Win 98 | 1804.9 | ||
| Pentium II | 450 | 128 | ? | Win NT4 | 1281.9 | 26.0 | 40.8 |
| Pentium III | 450 | 128 | ? | Win 98 | 1196.3 | ||
| Pentium III | 500 | 256 | ? | Win 98 | 1127.0 | 10.0 | 6.1 |
| Pentium III | 550 | 128 | ? | Win 98 | 1312.8 | 9.09 | 14.2 |
| Pentium III | 600 | 512 | ? | Win NT4 | 1054.5 | 8.33 | 24.5 |
| Pentium III | 700 | 256 | ? | Win 98 | 1008.6 | 14.3 | 4.6 |
| Pentium III (Dual) | 733 | 512 | ? | Win NT4 | 842.0 | 4.5 | 19.8 |
| Pentium III | 1000 | 512 | ? | Win 2000 | 743.0 | 26.7 | 13.3 |
| Pentium III (Dual) | 1000 | N/A | N/A | N/A | 739.8 | 0.0 | 0.43 |
| Pentium 4 | 1500 | 128 | ? | Win NT4 | 490.4 | ||
| Pentium 4 | 1700 | 128 | ? | Win NT4 | 416.5 | 11.8 | 17.7 |
| Pentium 4 | 1800 | 128 | ? | Win NT4 | 413.3 | 5.6 | 0.78 |
| Pentium 4 | 2400 | 128 | ? | Win NT4 | 304.1 | 25.0 | 35.9 |
| Pentium 4 | 3200 | 128 | ? | Win NT4 | 202.5 | 25.0 | 50.2 |

